
Hi, just a few suggestions : - check the output data for each step to find where it fails. - print the FK amplitude spectrum to check your filter parameters (why do you use 3 parameters for the filter ? slopes=-something,+something amps=0,1 should be ok to keep positive slopes. Before and after FK filtering. - use suxwigb key=gelev (or the parameter describing geophone depth) to produce well labeled plots of the seismic data in T-Z domain instead of suximage - I prefer to pick the first breaks before FK (or zero phase F) filtering
Hope it helps
D.
Le 25/08/2020 à 01:35, Erdi Apatay a écrit :
Hello All
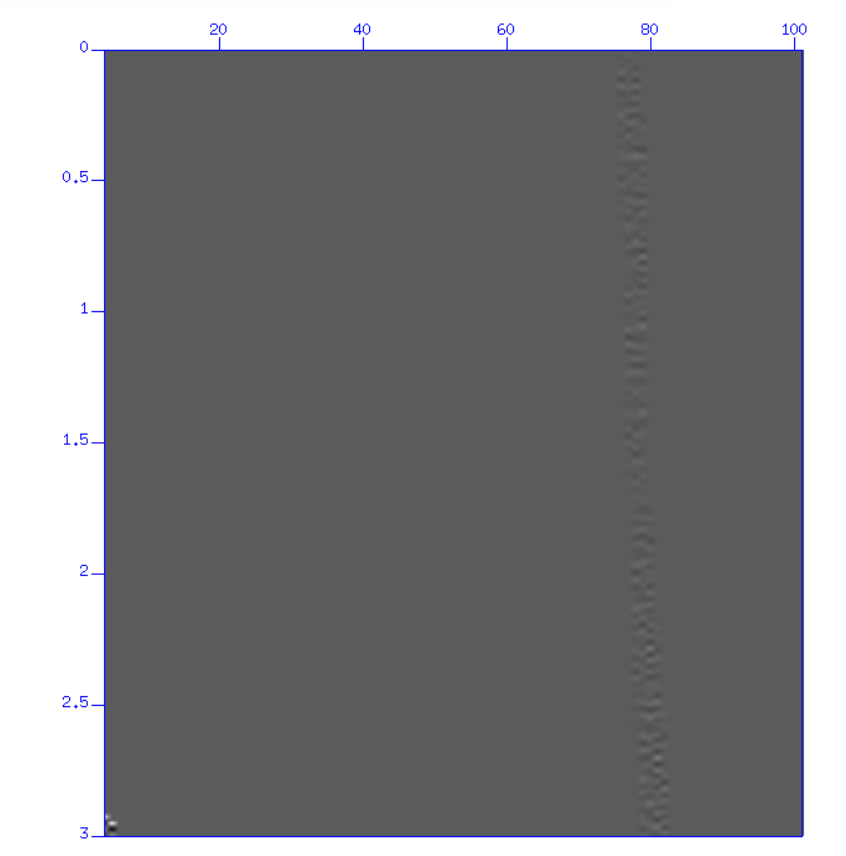
I have a script I am using for Zero Offset VSP processing. First of all, my first three traces looked cut so I rejected them. After getting rejected file, I filtered out the downgoing wavefield by sudipfilt. Then, I picked arrivals on the zero amplitude line corresponding to picking amplitudes. Then, I converted those arrival times (seconds) to milliseconds and saving them in a txt.file. After that, txt file is converted from ascii to binary format. Finally, I am adding those time values to the traces by sustatic command. At this point, however, when I try to plot the flattened upgoings, the script plots just a so narrow part as follows: fkfiltflat.PNG
Can you help me with this issue? I tried to change a lot of things but I could not get whole flattened upgoings.
If you would like to check my script, I added here.
Thank you Erdi
Seisunix mailing list Seisunix@mailman.seismic-unix.org https://mailman.seismic-unix.org/listinfo/seisunix